Latest Works
 LinkedIn Post Generator
LinkedIn Post Generator
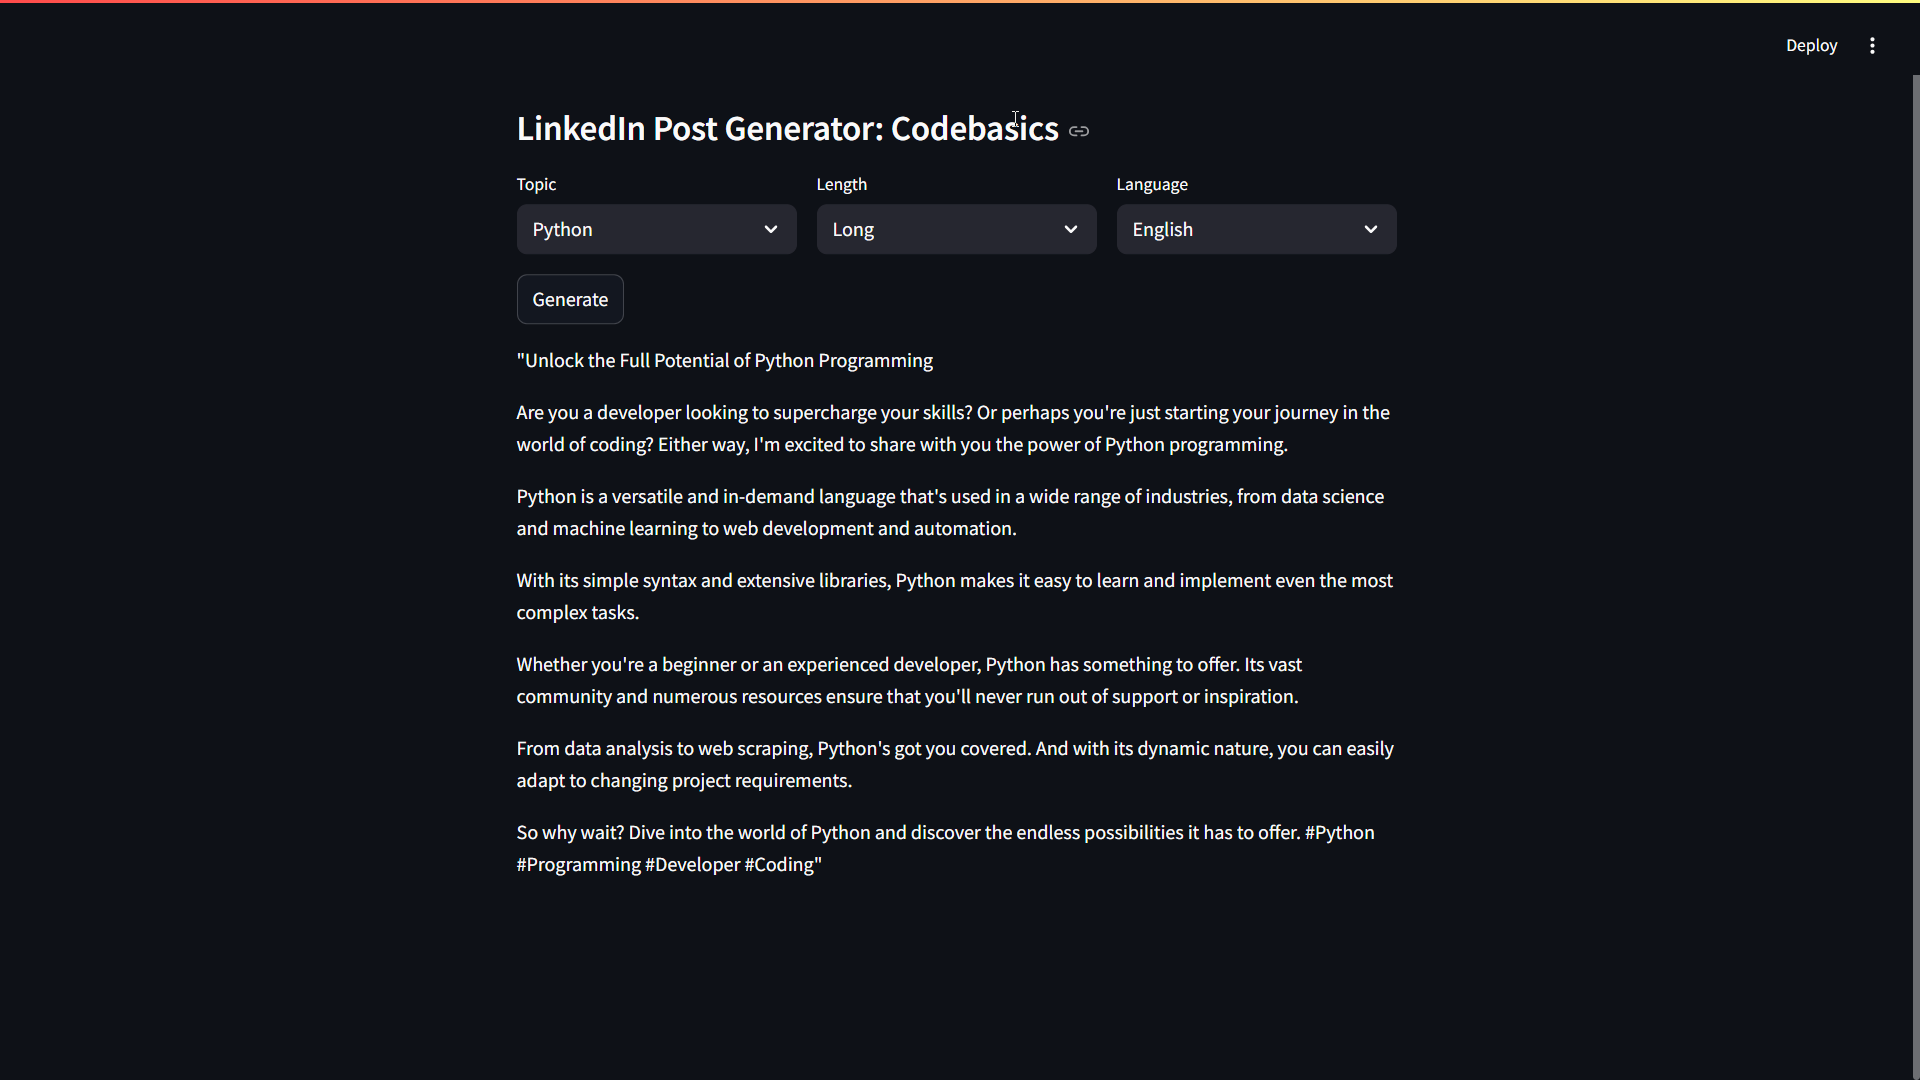
(LinkedIn Post Generator)Just built a LinkedIn Post Generator using Python + Streamlit + OpenAI API. It helps you instantly generate professional LinkedIn content on topics like Python, Data Science, and more. Select topic, length, and language — and generate posts in seconds! Proud to be learning and building along the way.
- #Python
- #Streamlit
- #OpenAI API
- #LLM
OLA
(OLA dashboard)OLA ride analysis dashboard, transforming raw trip data into meaningful insights. This dashboard provides: Ride trends ,Distances analysis ,Revenue ,Driver & customer Ratings
- #PowerBI
- #Excel
- #MongoDB
- #MySQL
- #DataVisualization
- #BusinessIntelligence
.png) OLA
OLA
 Healthcare_project
Healthcare
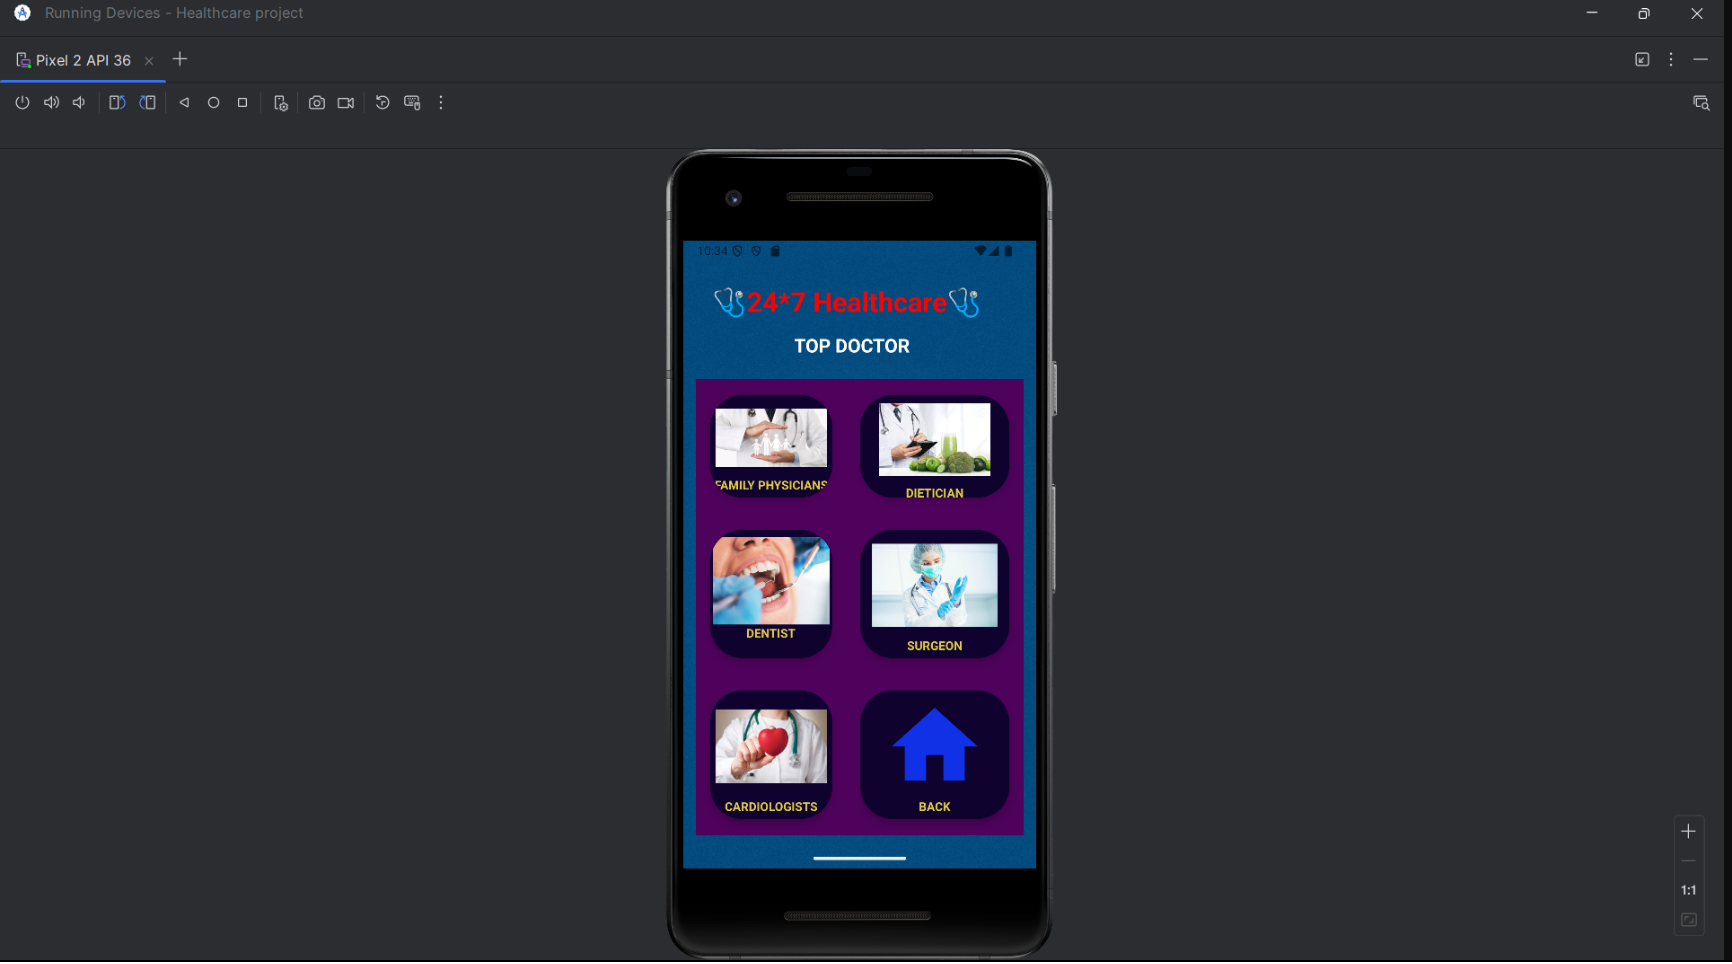
(Healthcare_project)Healthcare Android Application developed using Android Studio! Health information and services. It includes features such as: Health Articles Section – Users can access detailed articles on various health topics like walking daily, COVID-19 care, stop smoking, and more, each with visual guides and tips.
- #Java
- #Java/Kotlin
- #MobileAppDevelopment
- #XML
- #Firebase
- #HealthcareApp
- #UIUX
Papollo
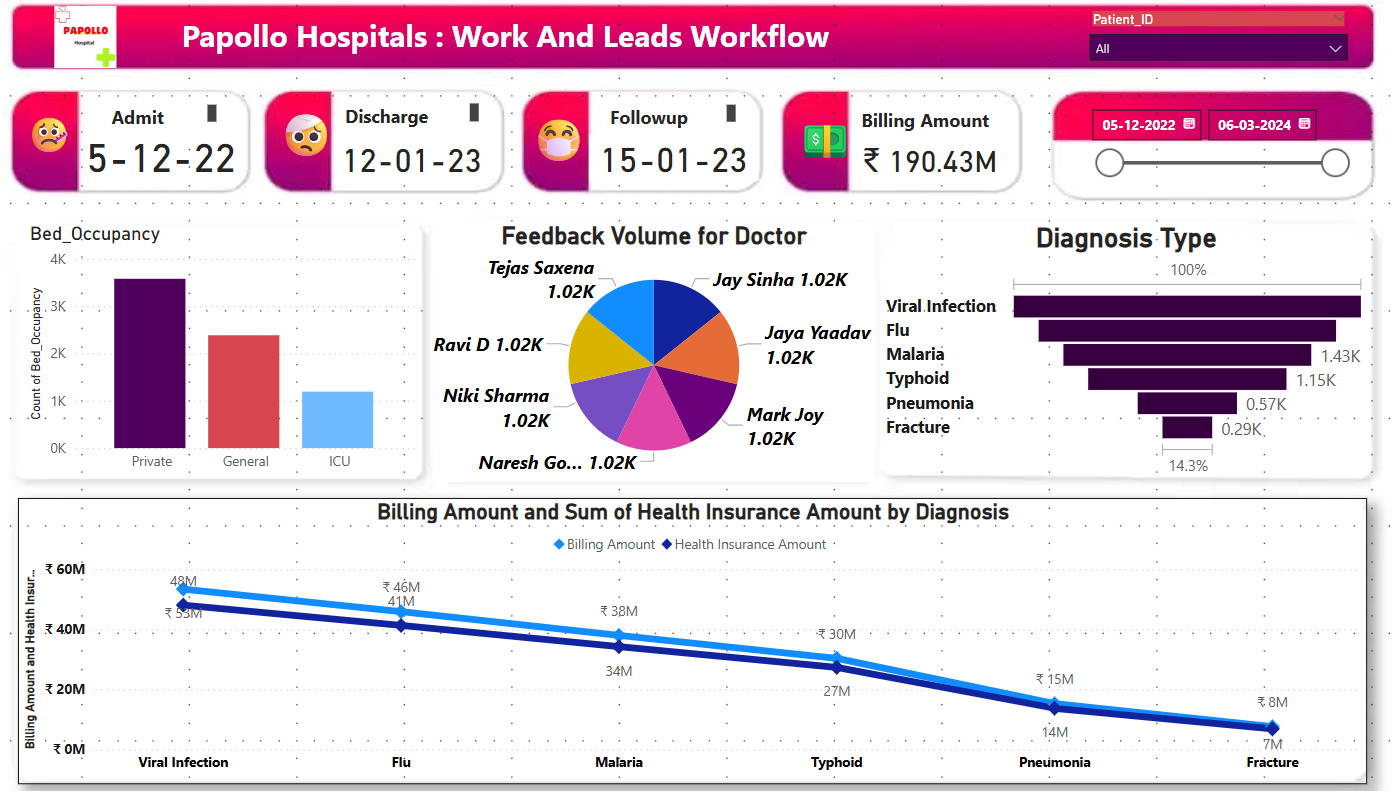
(Papollo-Hospital-Dashboard)Hospital Workflow Dashboard designed for Papollo Hospitals. This tool enables seamless tracking of key metrics and enhances decision-making in patient care and hospital operations.
- #PowerBI
- #Excel
- #MySQL
- #HealthcareAnalytics
- #DataAnalytics
- #DataVisualization
- #BusinessIntelligence
 Papollo